A model can work perfectly on launch day. Then, three months later, it quietly starts making worse decisions. Nobody notices, because nobody is watching. This is exactly why model monitoring and data drift deserve a place in every machine learning workflow, not just an afterthought once something breaks.
This article is the companion piece to Episode 102 of the Intelevo YouTube series. In the video, we walk through the same ideas with a live screen, real code, and a simple analogy that makes the whole topic click. Here, you get the full written version, so you can read at your own pace, copy the code, and revisit it whenever you need a refresher.
In the previous episode, EP101, we solved a specific problem: losing track of model versions. Every training run got a name, a date, and a record of what changed. That solved forgetfulness. However, it didn’t solve a quieter, more dangerous problem. A versioned model can still go stale. It can still drift away from reality while nobody is looking. That’s where model monitoring and data drift enter the picture.
Why a Working Model Can Still Fail
Here’s the uncomfortable truth: a machine learning model doesn’t know when the world around it changes. It only knows the patterns it learned during training. Once you deploy it, the model keeps making predictions based on those old patterns, forever, unless something intervenes.
Meanwhile, the real world doesn’t sit still. Customer behavior shifts. New product categories appear. Economic conditions change. Fraud patterns evolve. As a result, the gap between what your model learned and what’s actually happening grows wider every day. Eventually, that gap becomes visible in the numbers: lower accuracy, worse recommendations, or missed fraud cases.
The scary part is the timeline. This decline doesn’t happen overnight. Instead, it creeps in slowly, which makes it easy to miss. Without a system for model monitoring and data drift detection, you might not notice for weeks. By then, the damage is already done.
A Simple Analogy: The Doctor’s Annual Checkup
Think about your own health for a moment. You don’t wait until you collapse to see a doctor. Instead, a good doctor checks your vitals on a regular schedule: blood pressure, weight, sugar levels. None of these checks happen just once. They happen again and again, because your body keeps changing.
This habit matters for three reasons, and each one maps directly onto machine learning.
First, vitals get checked regularly, not just at the start. A single healthy reading on day one tells you nothing about day two hundred. Second, small shifts count as real signals. A number that creeps upward over several months matters more than one unusual reading on a bad day. Third, early action beats a late rescue. Catching a problem at a routine checkup is far better than catching it in an emergency room.
Now, swap “patient” for “model,” and “vitals” for “predictions and data.” Suddenly, the entire discipline of model monitoring and data drift makes intuitive sense. You’re just running a checkup for your model, on a schedule, instead of hoping nothing goes wrong.
Naming the Idea: What Model Monitoring Actually Means
Model monitoring is the practice of watching a deployed model’s inputs, predictions, and performance over time. The goal is simple: catch problems caused by changing data before your users do.
It fits into a larger workflow that looks like this:
Deploy → Monitor → Detect → Alert → Retrain
You already know Deploy from earlier episodes. It’s the moment your model goes live. From there, Monitor and Detect take over. This is the heart of today’s topic. Once a problem is detected, Alert notifies the right person, and Retrain closes the loop by producing a fresh, updated model.
Notice something important here: Retrain doesn’t mean starting from scratch every time. Instead, it means training on more current data, then deploying that new version using the same versioning habits from EP101. Monitoring and versioning aren’t separate systems. They work together, as two halves of one healthy practice.
Two Kinds of Drift You Need to Know
The word “drift” gets used loosely, so let’s define it clearly. Drift simply means the world has moved on from what your model learned. However, it shows up in two distinct ways, and the difference matters.
Data Drift: The Inputs Change
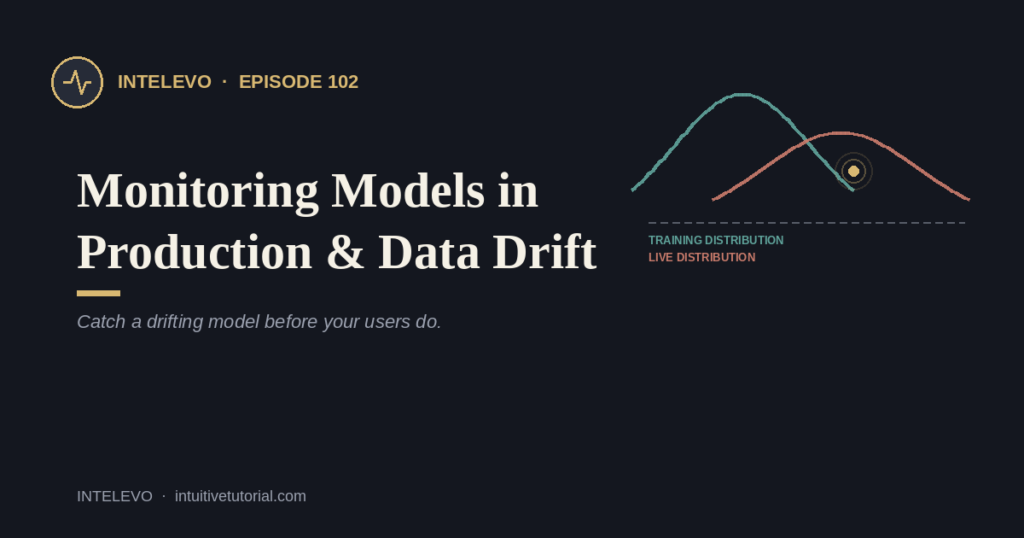
Data drift happens when the inputs to your model start looking different from your training data, even though the underlying relationship between inputs and outputs stays the same.
For example, imagine an app that suddenly gets a wave of new users from a country it never had labeled data for. Their behavior patterns, language, and purchase habits differ from your original training population. The model’s logic hasn’t changed. Still, the incoming data no longer resembles what the model learned from.
Concept Drift: The Meaning Changes
Concept drift is trickier. Here, the relationship between input and outcome shifts, even if the input itself looks similar.
Consider a spam filter trained before 2020. Back then, it learned what scam emails looked like. Since then, scammers have changed their wording, tactics, and formatting. The same kind of email now carries a different meaning. What used to signal “safe” might now signal “spam,” and vice versa. The pattern the model originally learned no longer holds true.
Understanding this distinction matters because the fix differs in each case. Data drift often calls for retraining on fresh, representative data. Concept drift, on the other hand, might require rethinking your features entirely, since the old signal-to-outcome mapping has broken down.
Why Monitoring Changes Everything
Let’s compare two worlds side by side, because the contrast makes the value obvious.
Without monitoring, when accuracy drops, nobody knows until a customer complains. When new user patterns appear, the model quietly makes worse and worse guesses, with no warning. Explaining a bad quarter becomes pure guesswork. Worse, teams often retrain on a fixed calendar, whether it’s actually needed or not, wasting effort and compute.
With monitoring, everything changes. A dashboard flags a drop within hours, not weeks. A drift score rises, and an alert fires early, before customers notice anything. Charts show exactly when and what shifted, turning guesswork into evidence. Consequently, you retrain only when the data actually calls for it, saving both time and resources.
That single comparison captures the entire case for model monitoring and data drift awareness in one place.
Four Signals Every Healthy Dashboard Tracks
So, what should you actually track? Four signals cover most of what you need.
First, watch input distributions. Ask a simple question: do today’s feature values still look shaped like the training data? Second, track the prediction distribution. If your model suddenly predicts one class far more often than usual, that’s a red flag worth investigating immediately.
Third, monitor performance metrics like accuracy and recall, measured against real outcomes as they arrive. Fourth, don’t forget system health: latency, error rate, and traffic. A slow or failing service can look exactly like a broken model, even when the model itself works fine. Therefore, separating model problems from infrastructure problems saves you from chasing the wrong fix.
How Detection Actually Works
Detecting drift sounds complicated, but the core idea is simple. Essentially, you compare two snapshots: the data your model trained on, and the data arriving right now. A statistical test puts a single number on the question, “how different do these two snapshots look?”
One popular choice is the Population Stability Index, or PSI. The formula looks like this:
PSI = Σ (Actual% − Expected%) × ln(Actual% ÷ Expected%)
Don’t worry about computing this by hand. A library handles the math in a single line of code, as you’ll see shortly. What actually matters is the rule of thumb that follows:
- PSI below 0.10 means the data is stable. No action needed.
- PSI between 0.10 and 0.25 signals moderate drift. Watch it closely.
- PSI above 0.25 signals significant drift. Investigate right away.
That’s genuinely all the math you need to carry forward. The formula matters less than knowing how to read the result.
Hands-On: Measuring Drift in Python
Now, let’s make this concrete with real code. First, install two packages:
pip install scipy pandas
Next, use the Kolmogorov–Smirnov test to compare two samples. This is a standard statistical method for checking whether two sets of numbers come from the same distribution.
from scipy.stats import ks_2samp

# training_data and live_data: same feature, two time windows
stat, p_value = ks_2samp(training_data, live_data)

if p_value < 0.05:
    print("Drift detected — distributions differ")
Here, training_data and live_data hold the same feature, such as average order value, measured across two different time windows. One reflects what the model trained on. The other reflects what’s arriving right now. The function returns two values: a test statistic and a p-value. The p-value is what you actually care about. If it drops below 0.05, that’s your signal: the two distributions differ in a statistically meaningful way.
Hands-On: Turning a Score Into an Alert
A number alone doesn’t help anyone unless it triggers action. So, let’s turn that score into a working alert.
drift_score = psi(expected=train_feature, actual=live_feature)

if drift_score > 0.25:
    send_alert(f"Drift detected: PSI={drift_score:.2f}")
    log_event("drift_alert", drift_score)
This snippet computes a drift score using a PSI function, comparing your expected, or training, feature against the actual, live feature. Then, it applies a simple threshold check. If the score exceeds 0.25, our “significant drift” boundary from earlier, two things happen. First, send_alert notifies whoever is on call. Second, log_event records the incident, creating a paper trail for later investigation.
That’s the entire loop: compute a score, compare it to a threshold, and let the alert do the watching. As a result, you don’t need to check dashboards manually every hour.
From Alert to Action: Closing the Loop
An alert firing is just the beginning, not the end. Here’s what typically happens next, in five steps.
Monitor comes first: dashboards continuously watch inputs and outputs. Detect comes next: a drift score crosses your threshold. Then comes Investigate, an often-skipped step. Before doing anything drastic, confirm the drift is real and not just a data pipeline bug.
Once confirmed, Retrain follows: train fresh on recent, representative data. Finally, Redeploy ships the new version. Notice that this last step loops directly back to EP101. Every retrain becomes a new tracked version, never an overwrite. In other words, monitoring and versioning aren’t competing systems. They’re two halves of the same discipline, working together.
Three Habits That Keep Models Healthy
Before wrapping up, here are three habits worth building into your workflow from day one.
First, set thresholds early. Decide what “too much drift” means while you’re calm and thinking clearly, not in the middle of a 2 a.m. incident. Second, watch predictions, not just accuracy. Real-world labels often arrive late, or sometimes never at all. Therefore, watching what your model outputs matters just as much as watching how right it eventually turns out to be. Third, review on a schedule. A five-minute weekly glance at your dashboard catches slow drift long before it becomes an actual crisis.
Three Mistakes First-Timers Make
Just as important, here are three traps to avoid.
Alert fatigue tops the list. If your thresholds are too sensitive, everything looks urgent, and eventually, everyone starts ignoring the alerts altogether. Watching accuracy alone is another common mistake. Real-world labels lag by weeks, so by the time accuracy confirms a problem, the damage is already old news. Finally, avoid retraining on autopilot. Blindly retraining every time an alert fires can bake a temporary blip into the model, treating a one-off anomaly as the new normal. Always investigate first, then act.
Quick Recap
Let’s pull everything together. Monitoring means watching a live model’s inputs, predictions, and performance over time. Data drift changes what comes in, while concept drift changes what it means. A drift score like PSI turns “does this look different?” into one comparable number. Alerts should trigger investigation, not automatic, blind retraining. And finally, every retrain becomes a new tracked version, so model monitoring and data drift detection work hand in hand with the versioning habits you already know.
Watch the Full Walkthrough
This article covers the core ideas, but the video walks through everything live, screen and all, including both code demos in real time. If you learn better by watching, head over to Episode 102 on the Intelevo YouTube channel for the complete session.
While you’re there, please like the video, subscribe to the channel, and share your thoughts in the comments. Your feedback genuinely shapes future episodes, and it helps more learners discover this series.
Next up is Episode 103, where we open the black box: Explainable AI and the ethical considerations that come with putting a model in front of real people. Thanks for reading, and see you in EP103.