Every machine learning model needs clean data. But clean data does not appear by magic. Someone builds a data pipeline to make it happen. In this article, we break down exactly what a data pipeline is, why it matters, and how you can build one yourself in a few lines of Python.
This article is the companion piece to Episode 30 of the Intelevo Machine Learning series on YouTube. Watch the video first for the full walkthrough, then use this article to review the concepts and revisit the code at your own pace.
Let’s get started.
Why Every Machine Learning Project Needs a Data Pipeline
Think back to every machine learning topic we’ve covered so far. NumPy arrays, pandas DataFrames, statistics, probability. Every single example used data that was already clean, structured, and ready to go.
Real projects don’t work that way. Real data arrives messy. It sits in different databases which comes from different APIs. It shows up in inconsistent formats, with missing values and duplicate rows scattered throughout.
So, who fixes all of that? A data pipeline does.
A data pipeline is the invisible machinery behind every dashboard, every trained model, and every clean spreadsheet you’ve ever trusted. Once you understand how one works, you’ll start seeing pipelines everywhere. And better yet, you’ll be able to build one yourself.
The Simplest Way to Understand a Data Pipeline: Think of a Kitchen
Here’s an analogy that makes everything click. Picture a restaurant kitchen.
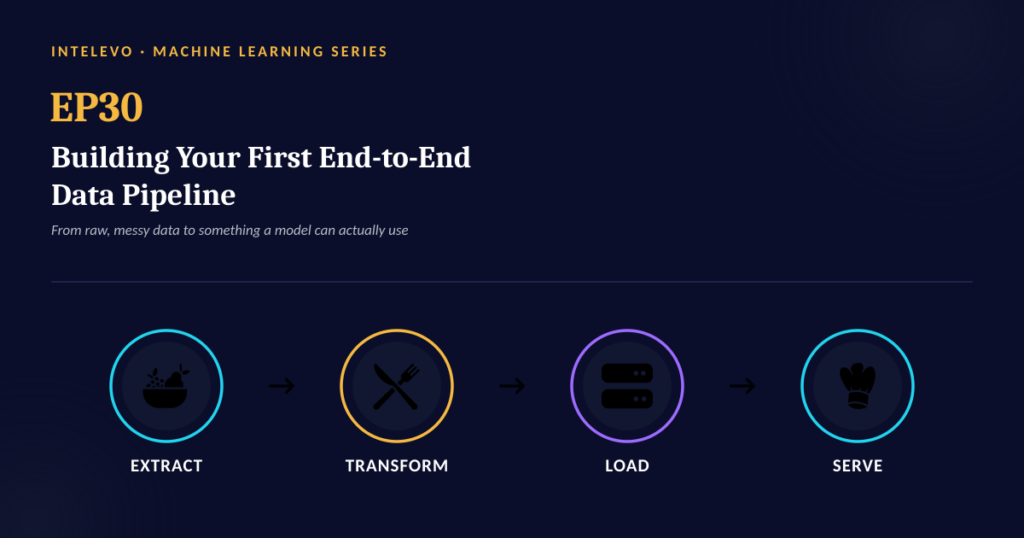
First, ingredients arrive. They’re raw, unsorted, and unwashed. Next, the kitchen staff preps and cooks them. Then, the finished dish gets plated and kept warm. Finally, a server delivers it to the guest at the table.
A data pipeline follows the exact same four-part journey, just with data instead of food:
- Extract — Raw data arrives, unchanged.
- Transform — The data gets cleaned, reshaped, and combined.
- Load — The finished, ready-to-use data gets stored somewhere organized.
- Serve — The data reaches the person, model, or application that needs it.
Keep this kitchen picture in mind. We’ll return to it throughout this article, because it makes every technical term easier to remember.
What Exactly Is a Data Pipeline?
Let’s put a proper definition to the idea.
A data pipeline is a series of automated steps that move data from where it lives to where it’s needed, cleaning and reshaping it along the way.
Three words in that definition matter more than the rest.
Automated. A real pipeline runs on its own. Nobody sits there manually copying and pasting between spreadsheets every day.
Directional. Data always flows one way, from a source toward a destination. It never loops backward.
Transformative. A pipeline doesn’t just move data from point A to point B. It also cleans and reshapes that data along the way, so the version that arrives at the destination is actually usable.
Once you hold onto those three words, the whole concept becomes far less intimidating.
The Four Stages of Every Data Pipeline
Every data pipeline, no matter how advanced, breaks down into the same four stages. Let’s walk through each one.
Stage 1: Extract — Sourcing the Ingredients
Extraction is where everything begins. In this stage, we bring raw data in from wherever it lives, without changing anything yet.
Data typically comes from three places. First, databases, where SQL tables hold transactional records like orders, customers, or inventory. Second, APIs, which deliver live data pulled directly from external services. Third, files, such as CSV, Excel, or JSON exports shared between teams.
Here’s the kitchen rule that applies here: you don’t wash or cut anything yet. You simply gather what you need.
Stage 2: Transform — The Prep and Cook
Transformation is where most of the real work happens. This is the stage that separates a genuinely useful pipeline from a sloppy one.
During this stage, four things typically happen.
First, we handle missing values. We either fill the gaps with a sensible default, or we drop the incomplete rows entirely.
Second, we remove duplicates, so every real record gets counted only once.
Third, we standardize formats. Dates need the same structure. Units need to match. Text casing needs to stay consistent.
Fourth, we engineer features. This means creating new, more useful columns out of the data we already have. For example, multiplying price by quantity to produce a new “revenue” column.
One small formula is worth knowing here, because you’ll see it constantly in real-world pipelines:
x’ = (x − min) / (max − min)
This is called min-max scaling. In plain terms, it squeezes every value in a column into a common zero-to-one range. As a result, no single column dominates a model’s attention just because its raw numbers happen to be larger.
Stage 3: Load — Plate It and Keep It Warm
Once the data is clean, it needs somewhere to live. That’s the Load stage.
For small projects, a simple CSV or Parquet file works perfectly well. This is exactly what we’ll use in today’s code example.
For bigger projects, especially when other tools need to query the same data, a database table becomes the better option.
And at true company scale, a full data warehouse gets built specifically for large-volume analytics.
The right choice always depends on scale. Start simple, and grow from there as your needs grow too.
Stage 4: Serve — Deliver It to the Guest
Finally, the data reaches its destination. This is the Serve stage, and it’s the entire reason the first three stages exist.
The finished data might feed a dashboard, so business teams can see live, trustworthy metrics. It might feed a machine learning model, which is exactly what we’ll build starting in Episode 31. Or it might power an API, so other applications can request it on demand.
Put all four stages together, and you get the complete loop: Extract, Transform, Load, Serve. That’s the entire recipe behind every data pipeline you’ll ever encounter.
Building a Mini Data Pipeline in Python
Theory is useful, but nothing beats seeing an actual data pipeline in code. Here’s a complete, working example in fewer than ten lines of Python.
import pandas as pd

# EXTRACT
df = pd.read_csv("sales_raw.csv")

# TRANSFORM
df = df.dropna(subset=["price", "qty"])
df["revenue"] = df["price"] * df["qty"]
df["order_date"] = pd.to_datetime(df["order_date"])

# LOAD
df.to_csv("sales_clean.csv", index=False)
Let’s walk through it, line by line.
First, we import pandas, the library that does most of the heavy lifting.
Next, for Extract, pd.read_csv loads our raw file, sales_raw.csv, straight into a DataFrame called df. Nothing gets changed at this point. We’re simply gathering the ingredients.
Then comes Transform, and three things happen in quick succession. df.dropna with a subset of price and qty removes any row that’s missing either value. That handles our missing data. Next, we create a brand-new column, revenue, by multiplying price and qty together. That’s feature engineering in action. Finally, we convert order_date into a proper datetime object using pd.to_datetime. That step standardizes the format, so every date behaves consistently from here on.
Last, for Load, a single line, df.to_csv, saves the finished result as sales_clean.csv. We also set index=False, so pandas doesn’t add an unnecessary column of row numbers to our output.
That’s genuinely it. Four lines of thinking. Four stages of the pipeline. Nothing hidden, and nothing magical. This is what a real data pipeline looks like at its smallest, most approachable scale.
Making Your Data Pipeline Run on Its Own
Running that script by hand every single day still counts as manual work. In our kitchen analogy, that’s a chef standing over every single dish, all day long. A proper data pipeline runs on its own, on a schedule, without anyone babysitting it.
Three ideas make that possible.
Scheduling triggers the script automatically, whether that’s every hour, every day, or every week. A common tool for this is called cron.
Orchestration manages the order of operations, handles retries, and tracks dependencies between different steps. Popular tools here include Airflow and Prefect.
Monitoring sends an alert the instant a step fails, well before anyone notices that bad data has slipped through unnoticed.
You don’t need to master these tools today. Just recognize the words when you hear them. We’ll build a fully scheduled data pipeline hands-on in a later episode.
Common Data Pipeline Mistakes to Avoid
Kitchens and pipelines fail in strikingly similar ways. Here are four mistakes worth watching for.
Skipping validation is like never taste-testing a dish. Bad data slips straight through, undetected, until it causes a much bigger problem downstream.
Hardcoding every step, without documentation, is like never writing the recipe down. The moment anything changes, upstream or downstream, the whole pipeline breaks.
Skipping logs means failures go unnoticed for days, much like nobody realizing a dish burned in the oven.
Non-repeatable steps produce different results on every run, the equivalent of cooking the same dish differently each time, with no consistency at all.
A Simple Checklist for a Healthy Data Pipeline
Fortunately, the fix for each of those mistakes is straightforward. Keep this checklist nearby as you build your own pipelines.
- Validate data at every single stage, not only at the very end.
- Log every step, so tracing a failure never becomes a guessing game.
- Make each run repeatable. The same input should always produce the same output.
- Keep Extract, Transform, and Load as separate, independently testable steps.
- Version your code and your data schema together, so you always know exactly what changed, and when it changed.
Follow these five habits consistently, and your data pipeline will stay reliable, even as your projects grow more complex.
Bringing It All Together
Let’s zoom back out. A data pipeline is genuinely just four stages, repeated automatically: Extract, Transform, Load, Serve.
That’s the entire idea. Every advanced tool, every buzzword, and every enterprise-grade platform you’ll hear about later is simply a bigger, faster version of this exact same loop.
Once that clicks, data pipelines stop feeling intimidating. Instead, they start feeling familiar, almost obvious, in the same way a well-run kitchen feels obvious once you’ve seen how it operates behind the scenes.
Three Things to Remember
Before you move on, hold onto these three ideas.
First, a data pipeline is simply Extract, Transform, Load, and Serve, repeated automatically, over and over again.
Second, garbage in still means garbage out. The Transform stage is where real quality gets earned, so never skip it.
Third, start small. A single Python script, exactly like the one we wrote today, already counts as a legitimate, working data pipeline.
Frequently Asked Questions
Is a single Python script really a data pipeline? Yes, absolutely. A data pipeline is defined by what it does, not by how many tools it uses. If your script extracts data, transforms it, and loads it somewhere usable, it qualifies as a real data pipeline, even if it’s only ten lines long.
Do I need Airflow or Prefect to get started? No, not at first. Orchestration tools like Airflow become useful once you have several interdependent steps that need scheduling, retries, and monitoring. Until then, a well-organized script, run manually or through a simple cron job, works perfectly well.
What’s the difference between a data pipeline and ETL? ETL stands for Extract, Transform, Load, and it describes the first three stages of a data pipeline. A data pipeline is the broader term, because it also includes the Serve stage, where the finished data actually reaches a dashboard, model, or application.
How do I know if my data pipeline is reliable? Run it twice with the same input, and check whether you get the same output both times. If you do, your pipeline is repeatable. Add validation checks and logging on top of that, and you have the foundation of a genuinely reliable data pipeline.
What should I learn next after building a basic data pipeline? Once your data pipeline reliably produces clean, structured data, the natural next step is learning how to use that data. That’s exactly where Episode 31 picks up, with an introduction to regression problems.
What’s Next
Now that clean data is flowing in reliably, it’s time to put it to work. In Episode 31, we introduce regression problems, and we teach a model to predict a number directly from the data our pipeline just prepared.
Watch the Full Video
This article summarizes Episode 30 of the Intelevo Machine Learning series. For the complete walkthrough, including live narration and a shared screen showing every step in action, watch the full video on the Intelevo YouTube channel. If this explanation helped the idea of a data pipeline finally click for you, please consider liking the video, subscribing to the channel, and leaving a comment with your thoughts or questions. Every bit of feedback genuinely helps shape future episodes.