Computational Biology

Essential Molecular Biology for Bioinformaticians

As a bioinformatician, you will be working with large amounts of biological and molecular data, which means that you need to have a solid understanding of the fundamental concepts in these fields. Molecular biology is a fascinating and complex field of study that deals with the study of the biological processes at the molecular level. …

Essential Molecular Biology for Bioinformaticians Read More »

Breast Cancer Survival Prediction with Clinical and Gene Expression Data

This tutorial walks you through building a breast cancer survivability prediction classifier which use clinical and gene expression data by employing machine learning techniques. Overview Cancer is a disease in which cells in the human body grow uncontrollably. This phenomenon often spreads to other parts of the body. Human bodies contain trillions of cells. Human …

Breast Cancer Survival Prediction with Clinical and Gene Expression Data Read More »

Binomial Distribution

Introduction Probability distributions are cornerstones in the theory of machine learning. The entire field of machine learning is often theoretically viewed or explained from a probabilistic perspective. Compared to the linear algebraic point of view, the probabilistic perspective gives formulations of machine learning algorithms that are more impressive. Binomial distribution is one of the many …

Binomial Distribution Read More »

Visualizing Protein Structures in Jupyter Notebook

The Jupyter Notebook is best suited for doing as well as documenting empirical research. It can contain text, code images, videos, interactive content, and also nicely typesetting equations. This makes anyone doing simulations or empirical research prototype their work and share it with their colleagues. The same Jupyter notebook can be used to visualize protein …

Visualizing Protein Structures in Jupyter Notebook Read More »

matpotlib

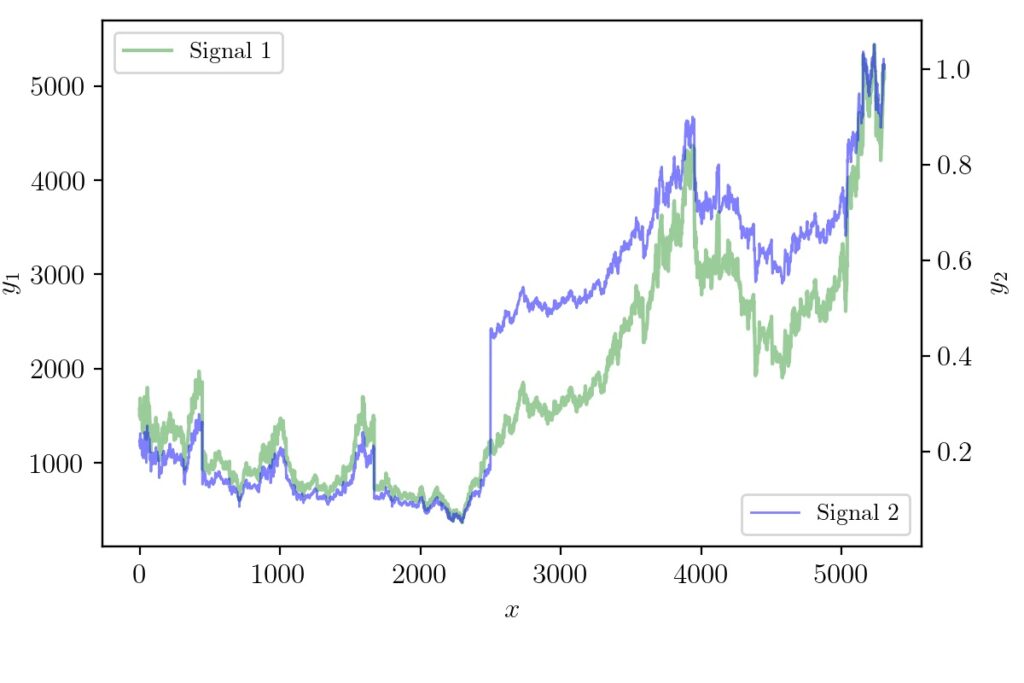
Python Matplotlib Tip: Overlapping Curves and Multiple Axes

In STEM fields it is often required to communicate ideas using graphs or infographics. Many times the dimensionality of data will be higher and require clever hacks to represent so that the reader gets the idea quickly. There have been systematic studies on how to do data visualization effectively. For data scientists or machine learning …

Python Matplotlib Tip: Overlapping Curves and Multiple Axes Read More »