
In summertime when I go out, I don’t take the raincoat with me. On what basis am I not expecting it to rain during summer?. Isn’t it my past experience gives me that knowledge and estimate the outcome?. The expected value in probability theory leverages such a pattern in data to make a good representation of data.
But wait, don’t we already have measures to represent data like mean, median, mode, variance, etc. ?. The convenience of them is to represent the data with just a single number.
Sometimes we plan our journey using the average time it takes to reach from point A to B. Sometimes such planning goes pretty bad also.
While selling a property we often prefer the maximum profit and when we buy we prefer the minimum expense. In short, the usage of mathematical measures is contextual. In this post, we will see the very reason for the existence of the expected value in probability theory.
Expected value can be thought of as an advanced version of mean value. The strength and weakness of the mean value is its sensitiveness to outliers. A single outlier can shift the mean value to a significant extent. The expected value tries to address this problem by using a weighted averaging operation.
Here we can relate the raincoat example to the probability of occurance. The experience element here is the probability of occurance of data values. Here we know that some data values are more frequent than others from experience.
A real-life scenario
Let’s take a real-life example. The graph below shows how the monthly wheat price (AFN) in Afghanistan changed from 2003-2017. It is interesting to note a price surge in 2008 and Afghan farmers tried to cope with that.

The average value of price here is 18.87 AFN, and we see why it fails the purpose of representing the data for the period. In such situations, the histogram of the same data gives better representation.

Here we can say the monthly wheat price was between 11-26 most of the time. Can we extend this to a single value so that we don’t lose much information but can still represent the data better than the mean value?.
The technical stuff
The idea is to use weighted averaging. Higher weightage is applied to frequent data points and less weightage to less frequent ones. The probability of occurrence of data points is their weightage value. Mathematically it is represented as
$\mathbf{E}[X]=\sum_{i=1}^{k}x_ip_i$
The summation is used instead of integral because we are dealing with discrete values.
What if all data values were equally probable? will the mean value and expected value be the same?. Yes, in such situations we will get the same result for both measures.
Another case is the probability distribution of data was not uniform but symmetric around a center point. Here also the mean value and expected value will be the same. The average value fails when the data is non-uniform and non-symmetric.
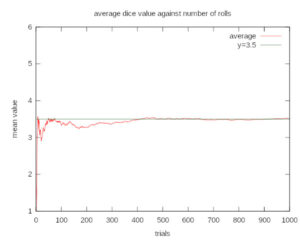
The law of large numbers states that the arithmetic mean of the values almost surely converges to the expected value as the number of repetitions approaches infinity. The expected value is also known as the expectation, mathematical expectation, or the first moment.
The key insight here is that the expected value is more of a theoretical measure representing the center value of a stream of numbers. The arithmetic mean approaches this value as the number of samples goes high enough. In some situations, we have access to the probability distribution (or experience). Then we don’t need a large number of data points to compute the single representative measure that is accurate enough.
An empirical example
The following figure shows how the average value of 6 side dice roll converges to its expected value as the number of trials increases.
Conclusion
Expected value forms the cornerstone of disciplines such as reinforcement learning (RL). RL algorithms use the expected value of the reward to achieve tasks. In general, all applications dealing with uncertainty and random variables heavily employ properties of expected value.