Tutorial

Visualizing Protein Structures in Jupyter Notebook

The Jupyter Notebook is best suited for doing as well as documenting empirical research. It can contain text, code images, videos, interactive content, and also nicely typesetting equations. This makes anyone doing simulations or empirical research prototype their work and share it with their colleagues. The same Jupyter notebook can be used to visualize protein …

Visualizing Protein Structures in Jupyter Notebook Read More »

matpotlib

Python Matplotlib Tip: Overlapping Curves and Multiple Axes

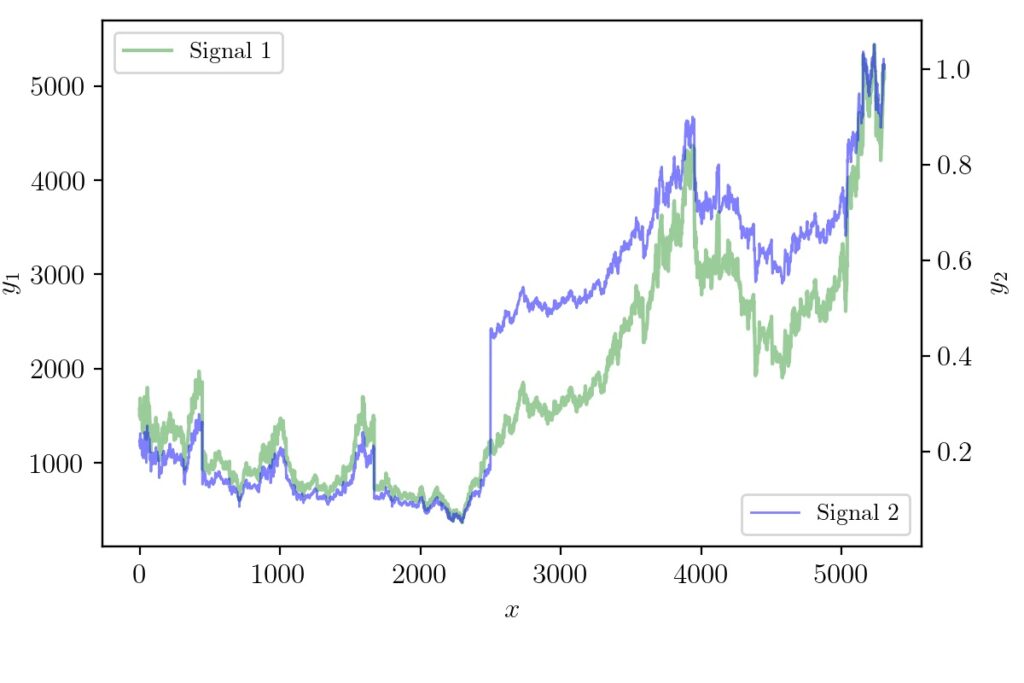
In STEM fields it is often required to communicate ideas using graphs or infographics. Many times the dimensionality of data will be higher and require clever hacks to represent so that the reader gets the idea quickly. There have been systematic studies on how to do data visualization effectively. For data scientists or machine learning …

Python Matplotlib Tip: Overlapping Curves and Multiple Axes Read More »

Bivariate Gaussian Distribution

Hacking the Bivariate Gaussian Distribution

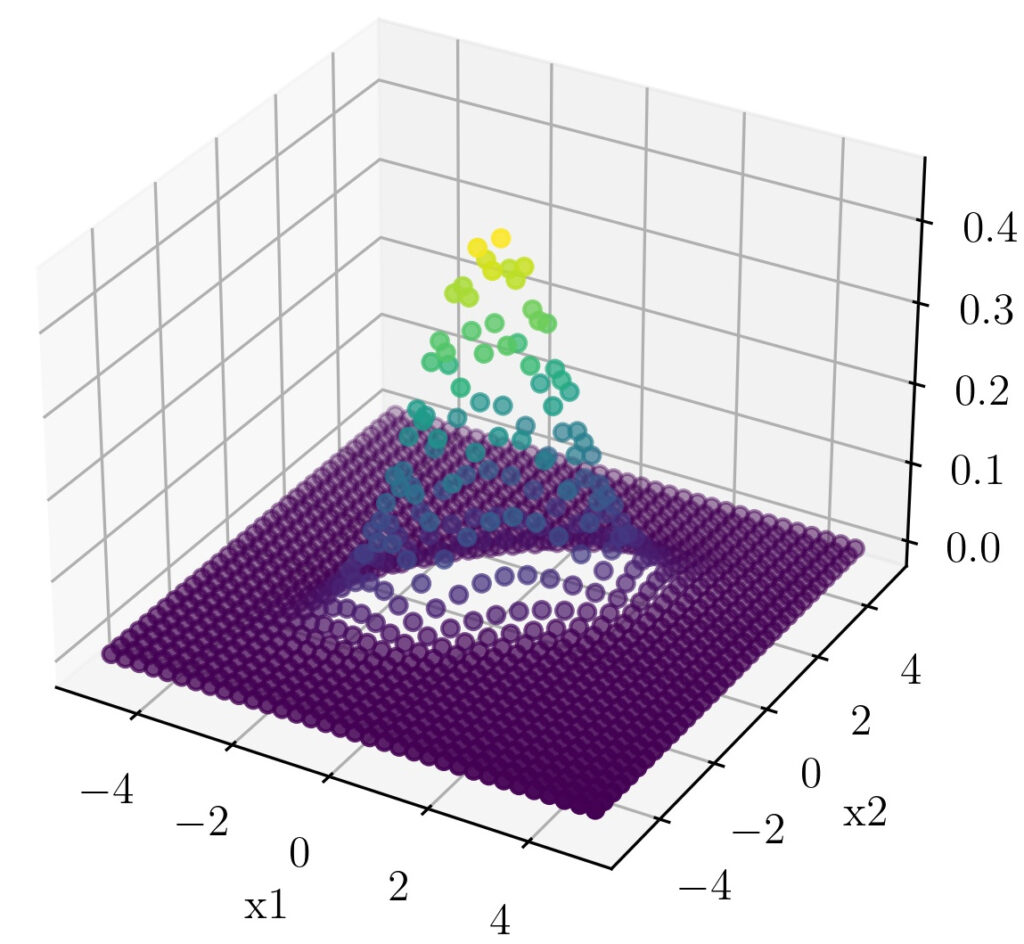
In one of our earlier posts, we have seen how we can visually relate the parts of the one-dimensional Gaussian distribution equation. In this post, we will follow the same strategy to understand the terms that comes up with a Multivariable Gaussian distribution. We will focus on the Bivariate Gaussian distribution as distributions of higher-order …

Hacking the Bivariate Gaussian Distribution Read More »

minmax scaling

Visualizing MinMax Scaling

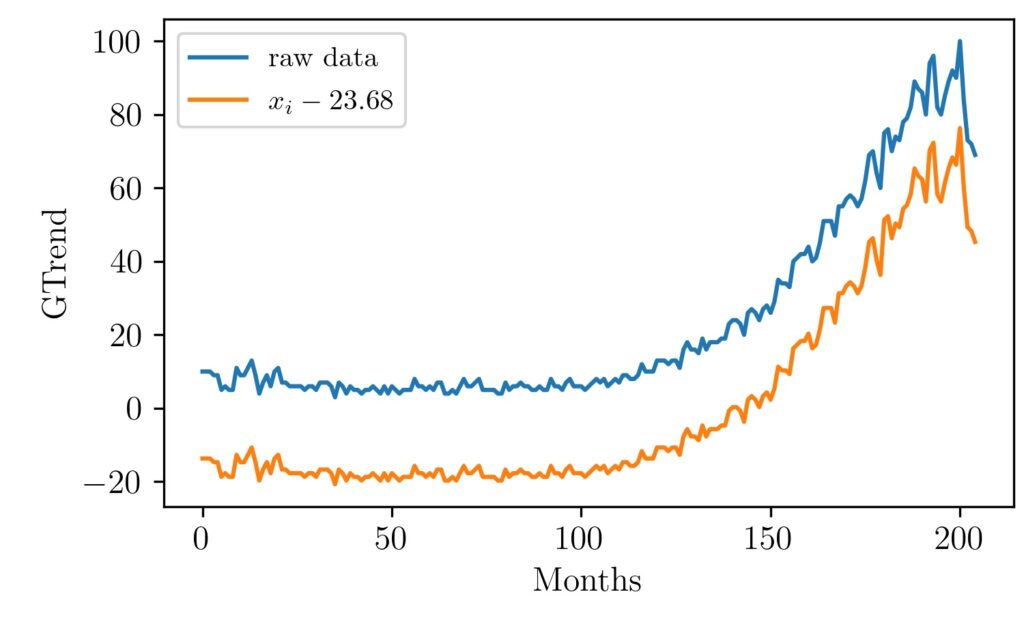
This article explains the minmax scaling operation using visual examples. Normalization of vectors, an array of values, signals is often used as a preprocessing step before many algorithms. For example, in machine learning, some types of algorithms are prone to different inherent scales of features. In such situations normalization is done to give the same …

Visualizing MinMax Scaling Read More »

Normal distribution visual explanation

Gaussian Distribution Explained Visually

Gaussian distribution appears in various parts of science and engineering. Apart from a distribution often appear in nature, it has got important properties such as its relation to Central Limit Theorem (CLT). The figure above shows one-dimensional Gaussian distributions of various mean and variance values. Libraries like NumPy provide functions that can return Gaussian distribution …

Gaussian Distribution Explained Visually Read More »

TwoStateMDP

Coding a Simple Markov Decision Process

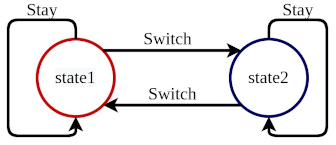
A Markov Decision Process (MDP) is a mathematical framework used to model decision-making situations where the outcome of a decision depends on both the current state of the system and the actions taken by the decision maker. In an MDP, the decision maker is represented as an agent, and the system is represented as a …

Coding a Simple Markov Decision Process Read More »

An Intuitive Explanation of Naive Bayes Classifier

Introduction In this post, let’s take a look at the intuition behind Naive Bayes Classifier used in machine learning. Naive Bayes classifier is one of the basic algorithms often encountered in machine learning applications. If linear regression was based on concepts from linear algebra and calculus, naive Bayes classifier mostly backed up by probability theory. …

An Intuitive Explanation of Naive Bayes Classifier Read More »